What Do The Unemployment Numbers Really Mean?
Read or Subscribe to all Tom Egelhoff’s Daily Blog Posts by Clicking Here
The Bureau of Labor Statistics has not always used the current measures of unemployment. The original set was first used in 1976. In 1994 they were redesigned to more closely reflect the (CPS) Current Population Survey based on new data.
Two recessions, the first in 2001 and the second in 2007-09, caused a wide fluctuation in unemployment numbers. The only similarity was that all six levels of unemployment increased.
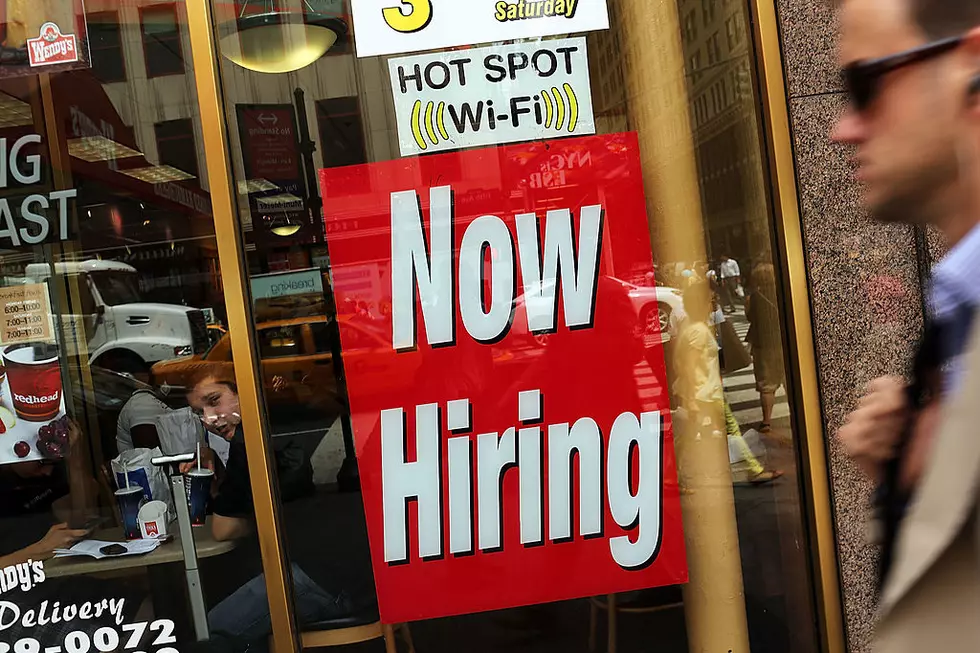
As of last Friday the reported unemployment rate is 5.8%. What does that really mean? Who’s counted and who’s not?
To fully understand unemployment you have to look at all the circumstances that are considered when the Fed’s compute their unemployment numbers.
How Many Kinds Of Unemployment Are There?
The Federal Government looks at six different scenarios when computing the unemployment rate. Here are the six and their definitions from the Wage and Hour Division below.
- U‑1: People who are unemployed for 15 weeks or longer as a percent of the civilian labor force. (Currently about 2.8%)
- U‑2: Job losers, plus people who completed temporary jobs, as a percent of the civilian labor force. (Currently about 2.9%)
- U‑3: Total number of people who are unemployed as a percent of the civilian labor force (official unemployment rate). (Currently 5.8%)
- U‑4: Total number of people who are unemployed, plus discouraged workers, as a percent of the civilian labor force plus discouraged workers. (Currently about 6.4%)
- U‑5: Total number of people who are unemployed, plus discouraged workers, plus all other persons marginally attached to the labor force, as a percent of the civilian labor force plus all persons marginally attached to the labor force. (Currently about 7.3%)
- U‑6: Total number of people who are unemployed, plus all persons marginally attached to the labor force, plus total employed part time for economic reason as a percent of the civilian labor force plus all persons marginally attached to the labor force. (Currently about 11.8%)
Some Final Thoughts
Regardless of what the numbers say, people out of work know they are out of work. It matters little to them as to which group they find themselves in.
It also doesn’t help that we currently have the lowest workforce participation rate since the 1970s.
While the U-3 number has come down in recent months, the U-4, U-5 and U-6 numbers have risen, as more discouraged workers stop looking for work.
While U-3 reductions might make politicians feel more comfortable, to the rank and file worker it’s just another manipulation of numbers to make someone else feel good, — everyone but the unemployed.
Read or Subscribe to all Tom Egelhoff’s Daily Blog by Clicking Here
More From AM 1450 and 95.1 FM