Ticket to (Bad) Ride: States with the Worst Drivers in 2021
Everyone has their own take on which states have the worst drivers, but the data shows that in 2021, these ten states have definitively earned the title.
Pointing the finger at other states for their bad driving is somewhat of a national pastime. Some say that California’s hectic and congested freeways cause erratic driver behavior; others argue that Florida’s sizable elderly population is cause for particularly inconvenient driving; and somehow, many more insist that Massachusetts simply is home to the worst of the worst. It seems that every American has their own opinion on where the worst drivers in the nation are, but without evidence, it can be hard to find an answer.
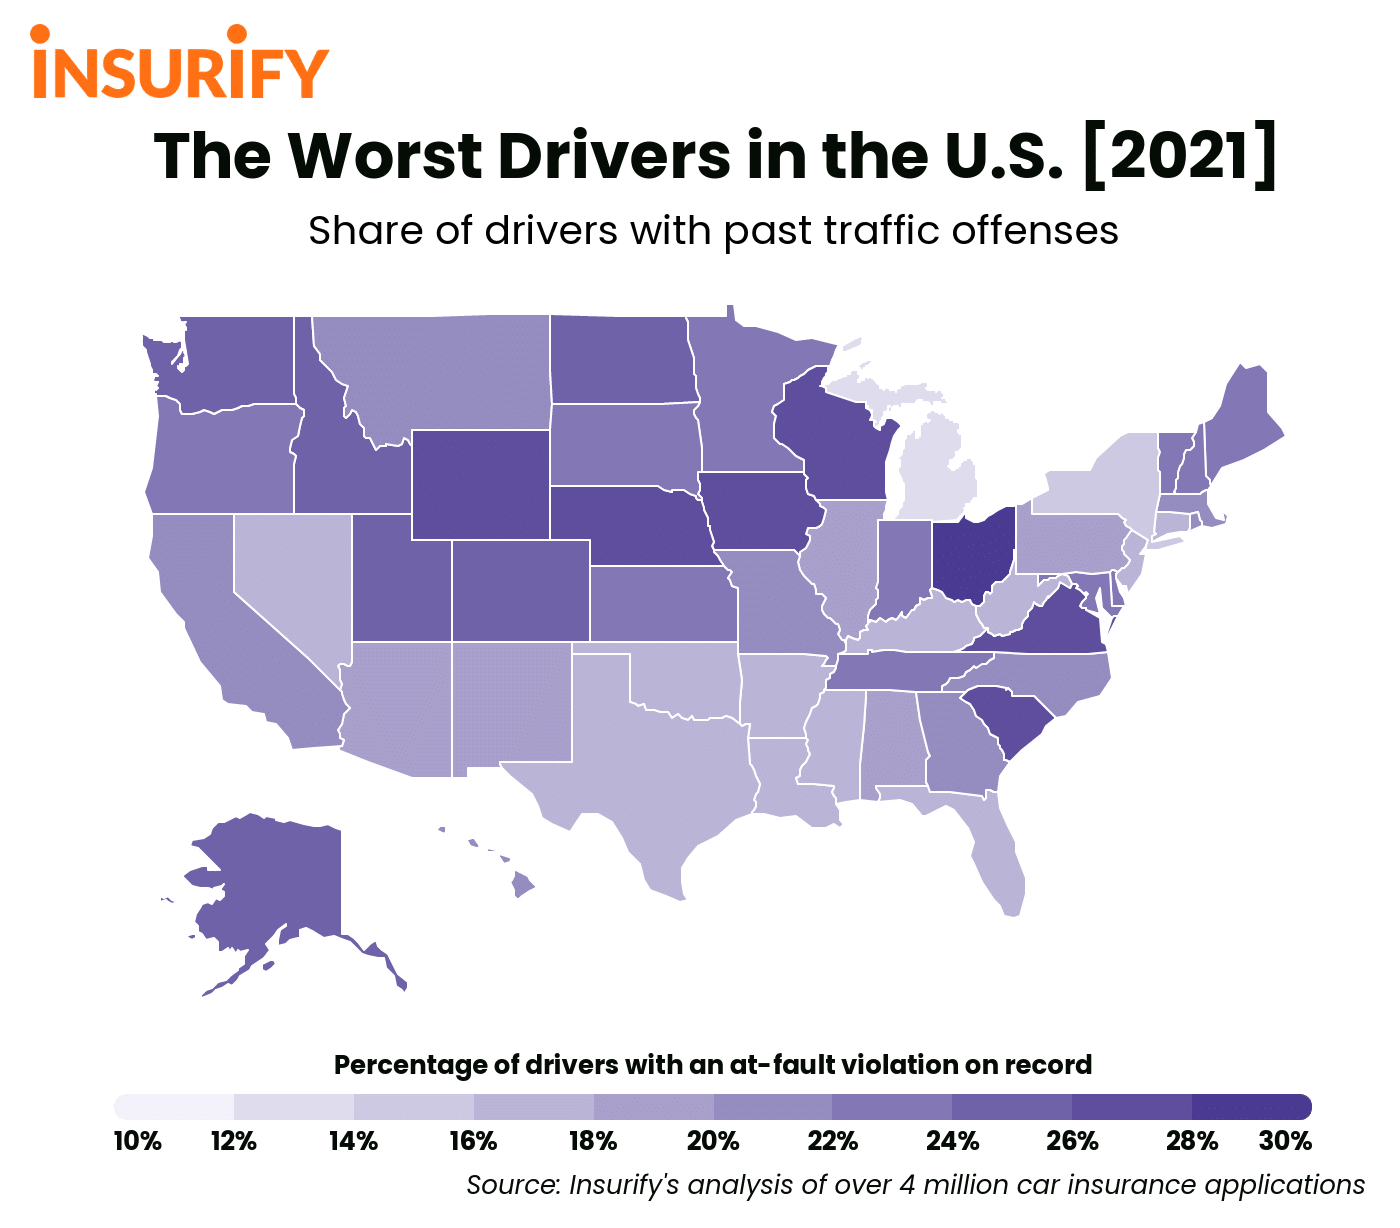
Bad driving manifests in a variety of ways, from failing to yield for others on the road, ignoring signage, or even driving under the influence. To see which states bring up the rear when it comes to good driving this year, the data scientists at Insurify turned to their database of over 4 million auto insurance applications.
Insights
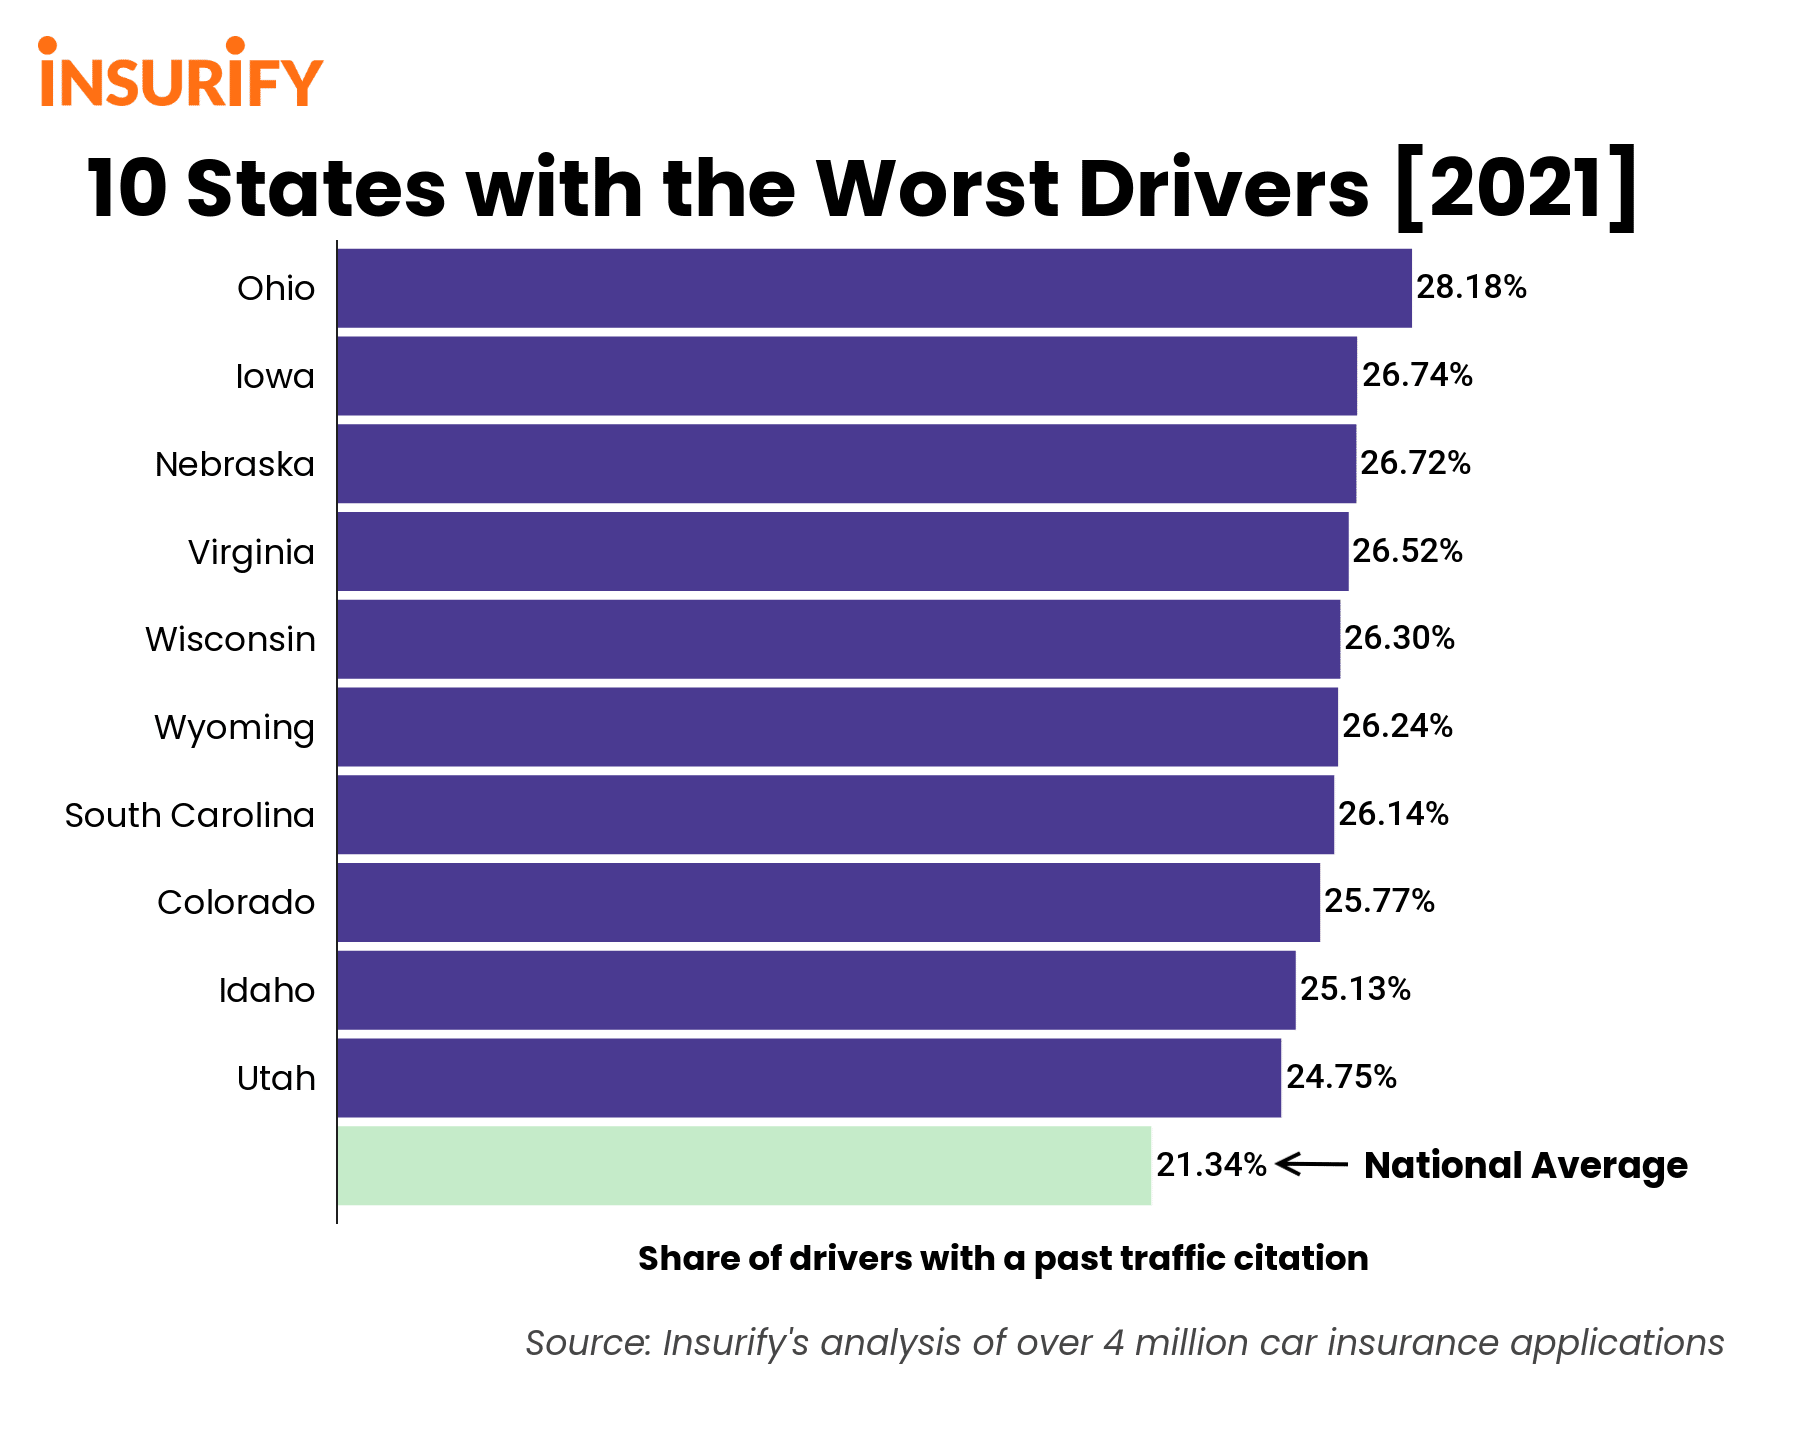
- National averages. The average state-wide share of drivers reporting a prior traffic incident is 21.34 percent. In 2019, the average number of traffic fatalities per 100,000 population in the U.S. was 11.0.
- Consistent driving trends over time. Nine of the ten states in the rankings for the worst drivers in America in 2021 had also made Insurify’s list for the top ten states with the worst drivers in 2019. While, for the most part, it seems that these states have maintained their less-than-perfect citation ratings, the most significant change from 2019 is that North Dakota, which ranked number one in the nation for the worst drivers in 2019, was the only state that did not make the top ten in 2021.
- Traffic citations and fatalities do not have a significant correlation. To examine the relationship between incident rates and driving-related fatalities across the nation, Insurify’s analysts conducted a regression test and found that the rate of drivers reporting a previous incident and the number of traffic deaths per 100,000 population are not significantly correlated. Within the top ten states with the worst drivers, only two are in the top ten states with the highest rates of traffic deaths, which suggests higher incident rates do not necessarily cause higher fatality rates. However, this finding by no means indicates that dangerous and rule-breaking driving is unrelated to safety on the roads — this statistic does not include injuries caused by accidents, which can be severe and life-altering. Drivers who fail to abide by driving laws threaten the safety of everyone around them and should be held accountable for their actions.
Methodology
The data scientists at Insurify, a car insurance comparison platform, referred to their database of over 4 million car insurance applications to identify the states with the worst drivers in the nation.
Applicants disclose their state of residence and any prior violations on their driving record when applying for car insurance. Insurify’s data scientists compared the number of drivers with one or more at-fault violations on record (including accidents, DUIs, failures to stop, speeding, reckless driving, passing violations, and other citations for illegal driving behavior) to the total number of drivers applying for car insurance in each state. The ten states with the highest proportion of drivers with at-fault incidents on record earned a spot in the rankings of the states with the worst drivers in America. Traffic fatality rates by state are from the Insurance Institute for Highway Safety’s most recent Fatality Facts report.

US States With the Worst Drivers 2021
1. Ohio - Percentage of drivers reporting past driving incident: 28.18%
2. Iowa - Percentage of drivers reporting past driving incident: 26.74%
3. Nebraska - Percentage of drivers reporting past driving incident: 26.72%
4. Virginia - Percentage of drivers reporting past driving incident: 26.52%
5. Wisconsin - Percentage of drivers reporting past driving incident: 26.30%
6. Wyoming - Percentage of drivers reporting past driving incident: 26.45%
7. South Carolina - Percentage of drivers reporting past driving incident: 26.14%
8. Colorado - Percentage of drivers reporting past driving incident: 25.77%
9. Idaho - Percentage of drivers reporting past driving incident: 25.13%
10. Utah - Percentage of drivers reporting past driving incident: 24.75%
States with the Worst Drivers
10. Utah
- Share of drivers reporting a prior incident: 24.75%
- Traffic fatalities per 100,000 population: 7.7 deaths
The Beehive State rounds out the rankings for having the tenth-worst drivers in the nation. Drivers in Utah are cited for illegal behavior on the roads at a rate that is 14 percent higher than the national average. While the rate of traffic fatalities is lower than average by 30 percent, it’s clear that Utahns could certainly exercise a bit more caution when behind the wheel.
9. Idaho
- Share of drivers reporting a prior incident: 25.13%
- Traffic fatalities per 100,000 population: 12.5 deaths
With a traffic incident rate that exceeds the national average by 16 percent, Idaho has the ninth-worst drivers in the nation. The Gem State has maintained a consistent spot in the rankings of the worst drivers in America since 2019: while the incidence rate of moving violations has decreased from 27.7 percent to 25.13 percent between 2019 and 2021, Idaho has remained in ninth place in the national rankings.
8. Colorado
- Share of drivers reporting a prior incident: 25.77%
- Traffic fatalities per 100,000 population: 10.3 deaths
With high altitudes and high rates of driving citations, the Mountain State has the eighth-worst drivers in the nation. In fact, drivers in Colorado are cited for illegal driving behavior at a rate that’s 18 percent higher than average. Traffic fatalities in Colorado are approximately on par with the national average. Unfortunately, dangerous driving is not an uncommon occurrence in Colorado.
7. South Carolina
- Share of drivers reporting a prior incident: 26.14%
- Traffic fatalities per 100,000 population: 19.4 deaths
Drivers are cited for traffic violations 19 percent more frequently than the national average in the Palmetto State. Not only that, but South Carolina is one of two states in the rankings that also is among the ten states in the nation with the most traffic-related deaths per capita. Indeed, with 19.4 traffic fatalities per 100,000 population, South Carolina ranks the fourth-highest in the nation by this metric. Staggeringly, traffic fatalities occur 44 percent more frequently in the state than the national average.
6. Wyoming
- Share of drivers reporting a prior incident: 26.24%
- Traffic fatalities per 100,000 population: 25.4 deaths
Wyoming drivers are the sixth worst in the nation. Not only do drivers in the Cowboy State have a traffic citation rate that’s 19 percent greater than the national average, but also, they have the second-highest DUI rate and fifth-highest rate of rude driving in the nation. On top of this, Wyoming is the state with the highest share of traffic fatalities in the nation, at 25.4 traffic fatalities per 100,000 population, a rate that’s 57 percent higher than the national average.
5. Wisconsin
- Share of drivers reporting a prior incident: 26.30%
- Traffic fatalities per 100,000 population: 9.7 deaths
The quintessential Midwestern charm certainly has its limits in Wisconsin, as drivers in the Badger State tend to engage in less-than-charming behavior on the roads: Wisconsin is fifth in the rankings for having the worst drivers in America. Wisconsinites are cited for breaking the rules of the road 19 percent more frequently than the average driver. Like Wyoming, Wisconsin has also made the rounds in the top ten rankings for states with the most DUIs and states with the rudest drivers in 2021, where the Badger State was ranked fourth and seventh, respectively.
4. Virginia
- Share of drivers reporting a prior incident: 26.52%
- Traffic fatalities per 100,000 population: 9.7 deaths
Virginia’s overall driving incident rate eclipses the national average by 20 percent, making its drivers the fourth-worst in America. The proportion of traffic fatalities in the Old Dominion is only marginally lower than the national average, and additionally, Virginia came first in the nation in Insurify’s report on rude drivers in the U.S. in 2021.
3. Nebraska
- Share of drivers reporting a prior incident: 26.72%
- Traffic fatalities per 100,000 population: 12.8 deaths
Nebraska has the third-worst drivers in the nation with a traffic incident rate that’s 21 percent higher than the national average. It’s clear that drivers in the Cornhusker State are no strangers to rule-breakers on the road. Nebraska also sees 15 percent more traffic fatalities than average. The data suggests that drivers in Nebraska err on the negligent side, which clearly has dangerous repercussions.
2. Iowa
- Share of drivers reporting a prior incident: 26.74%
- Traffic fatalities per 100,000 population: 10.6 deaths
Beating out Nebraska by a mere 0.02 percent, Iowa holds the second spot in the nation for having the worst drivers. With drivers racking up citations 21 percent more frequently than the national average, Iowa has moved up from third in the nation since Insurify’s 2019’s rankings. Iowa’s traffic fatalities rate is similar to the national average, indicating that Iowans would benefit from practicing more cautious driving.
1. Ohio
- Share of drivers reporting a prior incident: 28.18%
- Traffic fatalities per 100,000 population: 9.9 deaths
In 2021, the worst drivers in the nation can be found in the Buckeye State. Ohioans receive traffic citations 25 percent more frequently than the national average. While traffic fatalities in Ohio are slightly below the national average, Ohio drivers could benefit from using more tact when behind the wheel: not only are they the number one for overall citations, but they also hold the top spot in the nation for speeding tickets per capita, and the sixth in the nation for rude driving.
If you have any questions or comments about this article or would like to request the data, please contact insights@insurify.com.
More From AM 1450 and 95.1 FM